

The short answer
To use food system mapping software in municipal planning, define the food-system questions you need answered, inventory local food assets, load and verify them on a shared map, connect the map to your existing GIS, and give every department access — then use the shared picture to coordinate zoning, economic development and resilience decisions.
- Start with questions, not data The map exists to answer five concrete planning questions. Write them down before you look at software.
- Your first inventory already exists Licenses, inspections and permits surface most commercial food assets in an afternoon of exports.
- Seven steps, blank map to shared tool A rollout a small municipal team can run without a GIS specialist.
- Evaluate on plumbing, not aesthetics Data model, sharing, GIS interoperability and community update workflows.
- Fold it into work people already do Zoning review, grant writing and emergency response are what keep a map alive.
This guide lays out the process we see work in municipalities: a seven-step rollout that starts with questions rather than tools, plus the evaluation criteria and department-level use cases that turn a one-off mapping project into shared planning infrastructure. It is written for planning and economic development teams — no GIS background required. For the category basics, start with what food system mapping software is, or browse the rest of the food maps hub.
When should a municipality bring in food system mapping software?
The trigger is rarely a mandate that says “buy mapping software.” It is a cluster of familiar symptoms:
- Three departments keep three conflicting spreadsheets of farms, kitchens and food programs.
- A food policy council or community coalition asks for data the municipality cannot produce.
- A resilience or climate plan requires an inventory of local food infrastructure — and the last one was a consultant PDF from 2019.
- Grant applications keep asking for maps and asset counts that take weeks to assemble by hand.
If two or more of those sound familiar, a shared map will pay for itself in staff time alone. The American Planning Association’s Food Systems Planning guide has urged planners in this direction for years; the software finally makes it practical for small teams.
The pressure behind those requests is measurable, and it is the reason food keeps landing on municipal agendas:
24.0%
of Canadians — about 9.8 million people — lived in households reporting some form of food insecurity
Statistics Canada, The Daily, 2024 data published April 2026
Source2,165,776
visits to food banks in Canada in March 2025, the highest number ever recorded
Food Banks Canada, HungerCount 2025 — 5.2% above March 2024
SourceHow do you build a municipal food asset map?
A seven-step rollout
Step 1: Define the questions the map must answer
Write down five concrete questions before touching software — for example: which neighbourhoods lack food retail within walking distance, where is licensed kitchen capacity sitting idle, which food-security programs depend on a single distributor. The questions determine your data layers, and they are how you will know the project worked.
Step 2: Assemble a small cross-department working group
One owner, plus a named contact in each of planning, economic development, public health and emergency management. Cross-department collaboration is the whole point of a shared map, and it starts with people, not permissions. Keep the group small enough to meet monthly.
Step 3: Build the first food asset inventory
Start with data you already control: business licenses, health inspection records, zoning permits and lease registries surface most commercial food assets in an afternoon of exports. Layer in community knowledge — food policy councils, farmers' market managers and nonprofit partners know what the registries miss. Aim for a defensible first pass, not perfection.
Step 4: Choose the platform
With an inventory in hand, you know what your municipal planning tools must handle: your categories, your sharing needs, your GIS stack. The evaluation criteria further down this page are the short version; our buyer’s guide scores vendors in more depth.
Step 5: Load, verify and publish
Import the inventory, verify locations against place data, and publish a first map to the working group before going public. A soft launch surfaces embarrassing errors while the audience is still forgiving. Then publish a public view — visibility is what attracts corrections and new suggestions.
Step 6: Connect it to your GIS and open data
Good GIS for food systems flows both ways: your base layers — parcels, transit, flood zones — give the food map context, and the food layer exports back to the GIS team via files or API. If your platform cannot do either, it is a brochure, not infrastructure.
Step 7: Keep it alive
Assign ownership of the update queue, enable community suggestions with a verification step, and put the map on the agenda of every quarterly food policy meeting. Community food planning succeeds on cadence: a map that updates weekly earns trust; one that updates yearly loses it.
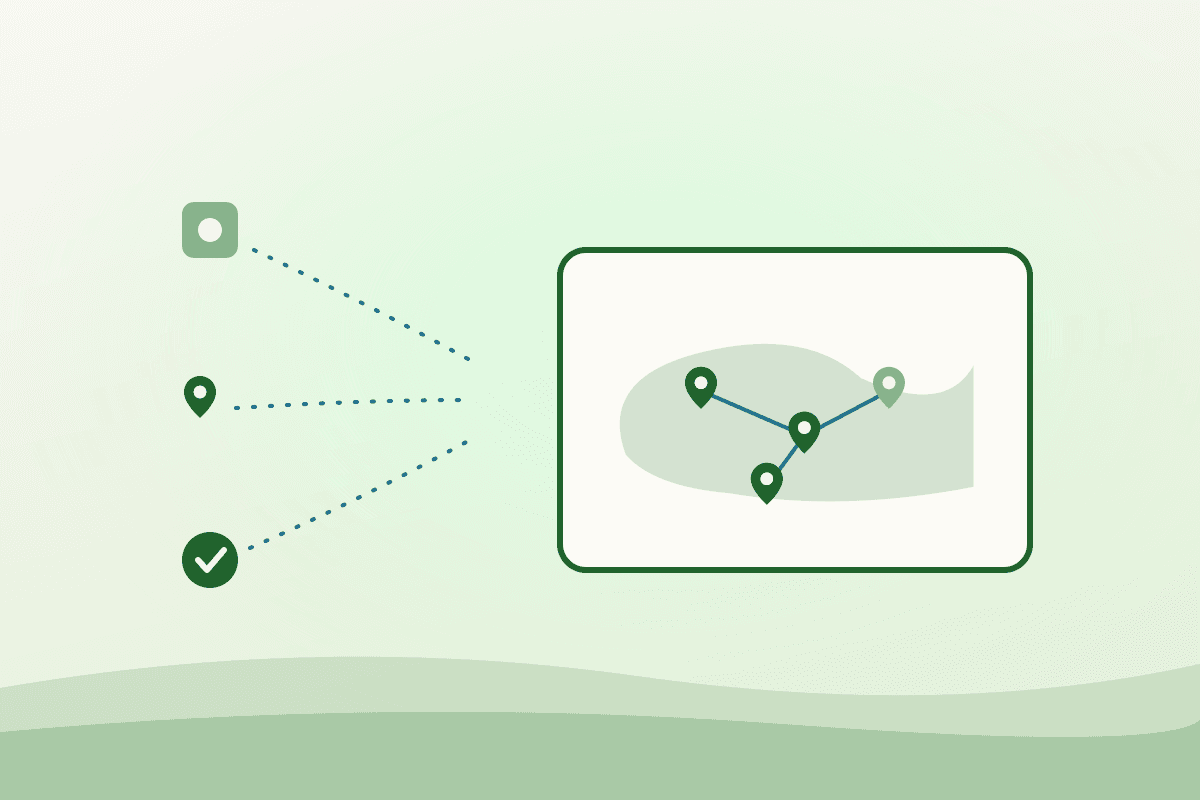
National context like the USDA Food Environment Atlas helps benchmark, but your street-level data is the asset — and step four is where most teams stall, so our guide to choosing food system mapping software turns it into a scoring exercise.
How do departments actually use the map day to day?
- Planning and zoning: check food retail and production coverage when reviewing applications and updating official plans.
- Economic development: point food entrepreneurs at available commercial kitchen capacity instead of losing them to the next town over.
- Public health: target food-access programs using current retail and food-security layers rather than census-lagged studies.
- Emergency management: know before a flood which kitchens, distributors and food banks sit in the affected zone.
- Sustainability: track compost, gleaning and recovery assets against waste-diversion targets.
What should you look for when evaluating platforms?
Six criteria separate durable municipal planning tools from pretty demos. Score every candidate — including “extend our existing GIS” — against all six.
| Criterion | What good looks like | Red flag |
|---|---|---|
| Food-specific data model | Production, processing, distribution, retail and food-security categories out of the box | You are asked to build and maintain the taxonomy yourself |
| Sharing and permissions | Department-level access, saved maps, and public and private layers | Per-viewer seat pricing that makes sharing a budget decision |
| GIS interoperability | CSV and GeoJSON exports plus an API your GIS team can script against | Export on request, or no API at all |
| Community updates | Public suggestion flow feeding a staff moderation queue | Only administrators can change a record |
| Embeds | Maps you can drop into municipal sites without custom development | An iframe that needs a developer and a ticket |
| Sustainable pricing | An entry point you can pilot without procurement, and tiers that scale with use | Enterprise-only pricing with a mandatory implementation fee |
Platform-specific details are in our overview of the Food Web Asset Mapping Platform, and you can try the portal itself at maps.foodweb.network.
Frequently asked questions
- How long does it take to stand up a food asset map?
- Weeks, not years. Municipalities that start from license and inspection exports typically publish an internal draft map within a month and a public map within a quarter. The long pole is verification, which community suggestions accelerate.
- Do we need GIS staff to run food system mapping software?
- No — that is largely the point. Planners and program staff maintain the food layer through a web interface, while your GIS team consumes clean exports or API feeds on their side. Both groups keep their own tools.
- How do we get other departments to adopt it?
- Give each department one query it cares about answered on day one, then embed the map where they already work — zoning checklists, grant templates, emergency plans. Adoption follows usefulness, not memos.
- What does a pilot cost?
- You can pilot at zero cost using Food Web's free public map, then move to a paid portal when you need saved maps, embeds and private layers. Grant funding from resilience and economic development programs commonly covers the subscription.
- Who should own the map inside the municipality?
- One named person, usually in planning or sustainability, with a contact in each other department. Shared ownership with no owner is the failure mode: the update queue is nobody’s job and the map drifts out of date within a year.
Start with a map your whole team can open
Open the mapping portal at maps.foodweb.network to see how saved maps, layers and embeds work, or contact our team to scope a municipal pilot against your first five questions.
Sources
- Food insecurity in Canada, 2024 — Statistics Canada, The Daily, Apr 29, 2026
- HungerCount 2025 — Food Banks Canada, Oct 27, 2025
- Food Systems Planning policy guide — American Planning Association
- Food Environment Atlas — USDA Economic Research Service

Written by
Anna Purna
AI-assisted research and city guides, reviewed by the Food Web team
AI-assisted author, reviewed by the Food Web team.
Anna Purna is Food Web's AI writing assistant — an avatar named after Annapurna, the Hindu goddess of food, agriculture, and nourishment. The name is about abundance, not a person on staff. She drafts research-backed guides; a human editor reviews them before they go live.
Next step
See every food asset near you on one map
Commercial kitchens, farms, markets and processors, mapped and updated weekly.
No listing fees · 12% on completed bookings · Refunds inside the notice window