
The short answer
The Food Web Asset Mapping Platform is food system mapping software that gives a municipality one shared, continuously updated map of local food infrastructure — commercial kitchens, farms, processors, retailers and community food programs — with collaboration tools, embeddable public maps and an API, so every department plans from the same food data instead of reconciling four spreadsheets.
- Four parts, one database A free public map, a team portal with saved maps and embeds, a Platform API, and a partner portal for community programs.
- Freshness is structural Marketplace activity, community suggestions and place-data enrichment keep assets current between planning cycles.
- Built for departments, not analysts Planning, economic development, public health and emergency management all read the same live map.
- It complements your GIS Exports and an API hand the food layer to your system of record rather than competing with it.
- Pilot before you budget The public map is free, so a team can see what is already visible before any procurement conversation.
This overview covers what the platform includes, how municipal teams use it, how the data stays current, and how it connects to the GIS and reporting stack you already run. For category basics, start with what food system mapping software is; for a rollout plan, see our municipal how-to guide; and if you are still comparing vendors, our buyer's guide scores platforms against four criteria.
What is inside the platform?
Food Web's platform has four parts that work together:
- The public map — a free, continuously updated map of food assets that anyone can explore.
- The mapping portal at maps.foodweb.network — saved maps, custom layers, embeds for municipal websites, and team subscriptions.
- The Platform API at api.foodweb.network — programmatic access to asset data for GIS teams, dashboards, and open-data portals.
- The partner portal at partners.foodweb.network — where nonprofits and community partners manage programs like the kitchen credit system.
Underneath all four sits one asset database covering local food infrastructure: commercial kitchens, farms, processors, distributors, retailers, and community food programs, each with a verified location, category, and status.
Why do municipal planners choose food system mapping software?
Because the alternative is reconciliation work. Food data scatters across licensing, health, planning, and economic development systems, and every cross-department initiative starts with merging spreadsheets that disagree. A shared food asset mapping layer removes that step. The American Planning Association has long argued that food systems belong in core planning; the platform is what makes that practical for lean municipal teams.
It also helps to see the size of the thing being mapped. A municipal food layer is a local sample of a national picture that is both commercially significant and under visible strain:
8,800+
food and beverage processing firms with employees in Canada, about 92% of them small businesses
Competition Bureau Canada, March 2026 — the report also notes shared kitchens and food hubs let entrepreneurs avoid six-figure build-out costs
Source25,917
farms reporting direct-to-consumer sales — 13.6% of all farms in Canada
Statistics Canada, Census of Agriculture — 2020 data published February 2023
Source2,165,776
visits to food banks in Canada in March 2025, the highest number ever recorded
Food Banks Canada, HungerCount 2025 — 5.2% above March 2024
SourceThose three numbers sit in three different provincial and federal systems. Nobody hands a municipality the local slice of them, which is exactly the gap a food asset map fills — and it is why maintenance, not the first inventory, is the hard part. That finding is not just ours:
What can your departments do with it?
Planning and zoning
Overlay food assets on parcels and plans to check coverage, spot gaps in food access before they become food deserts, and ground official plan updates in current data rather than the last consultant study.
Economic development
See where commercial kitchen capacity sits idle and connect food entrepreneurs to it — Food Web's marketplace makes those kitchens directly bookable, which also keeps the capacity data honest.
Public health and food security
Map food banks, meal programs, and retail access together to target interventions, and share the same view with community partners so everyone plans against one picture of community food access.
Resilience and emergency management
Query which assets sit in a flood zone or heat-vulnerable area before the event, and coordinate response using live status rather than phone trees.
How does the platform keep data current?
A food asset map is only as useful as its last update, so freshness is built into the system rather than delegated to an annual review:
- Marketplace signal: kitchens and spaces bookable through Food Web keep their own listings current because their business depends on it.
- Community suggestions: residents and organizations propose additions and corrections through a moderated queue.
- Place-data enrichment: assets are checked against live place data to catch closures, moves, and renames.
- Editorial review: changes pass a verification step before publication, so the map stays authoritative.
How does it fit your existing GIS and data stack?
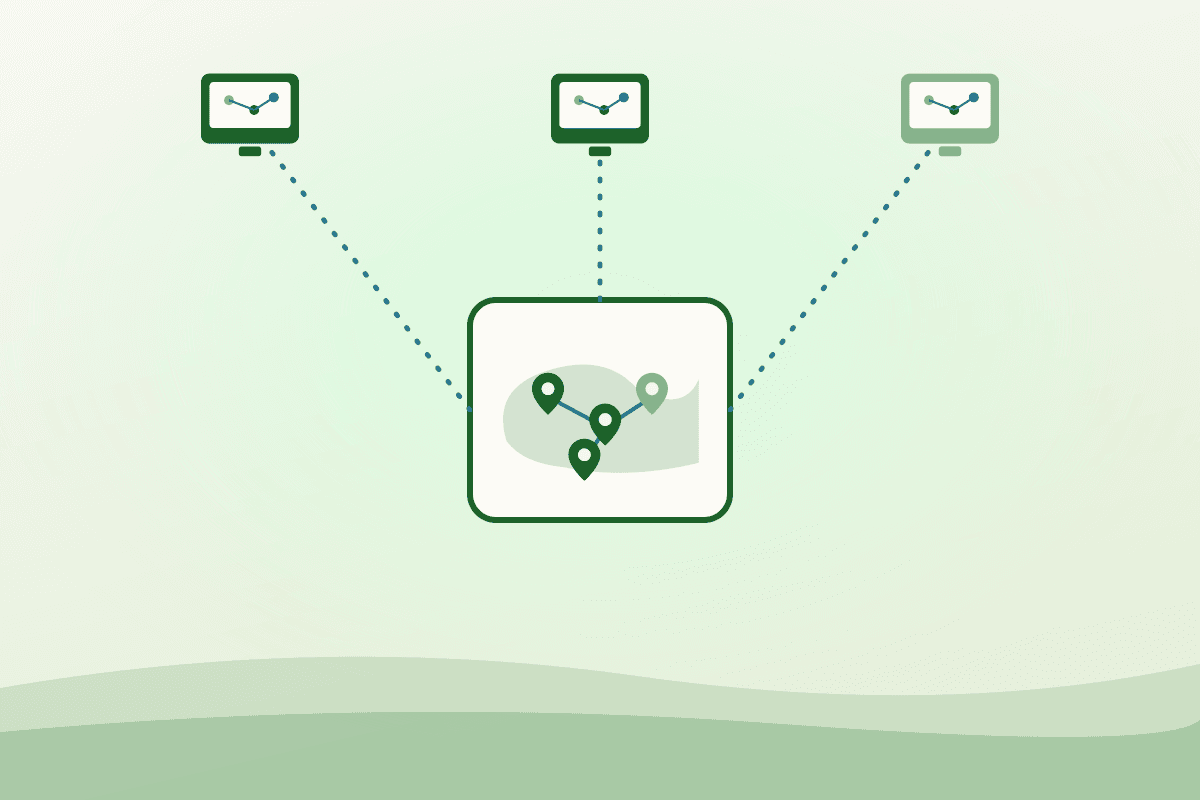
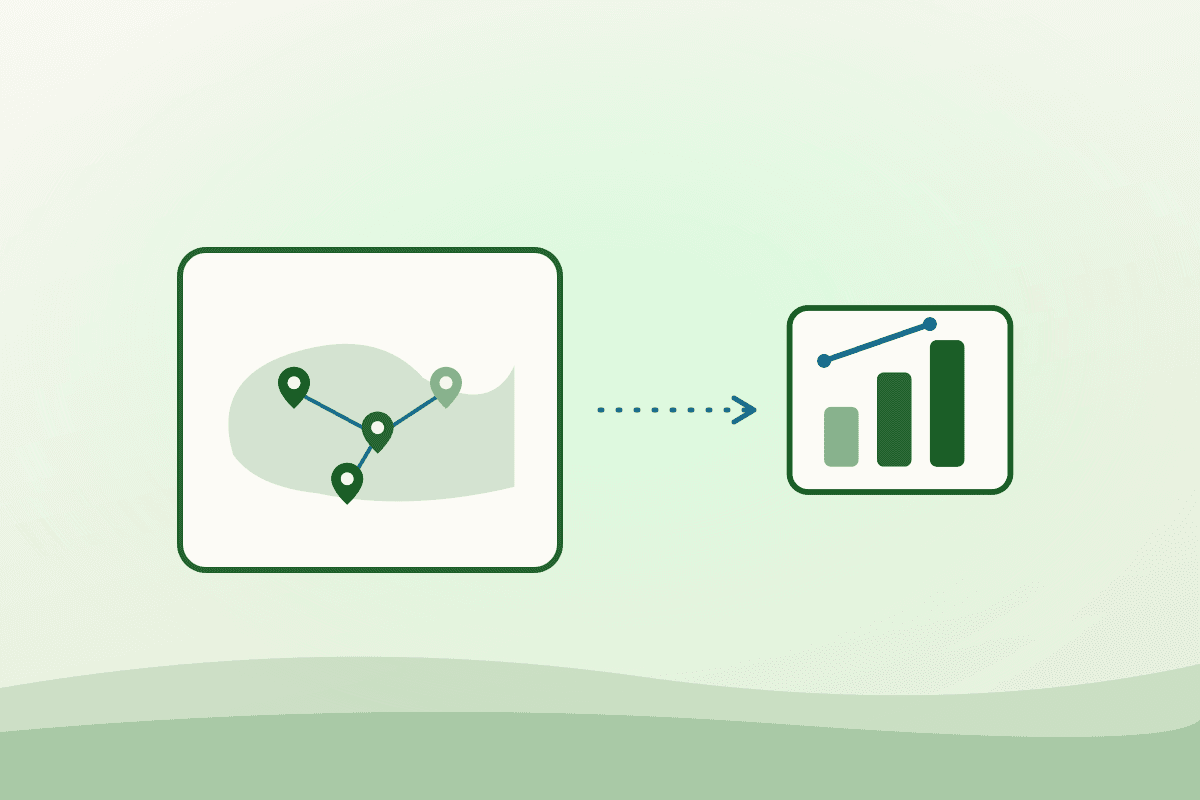
The platform is GIS for food systems, not a GIS replacement. Your team keeps parcels, utilities, and base layers where they are; the Asset Map contributes a maintained food layer through the Platform API and exports. Embed public maps in municipal sites with a snippet, feed dashboards from the API, and pull extracts into ArcGIS or QGIS on your own schedule.
Which of the four parts you need depends on what your team is trying to do:
| Part | Who it is for | What you get | Cost shape |
|---|---|---|---|
| Public map | Anyone — residents, staff, community partners | Browse and filter mapped food assets; suggest additions and corrections | Free |
| Mapping portal | A team that needs its own views | Saved maps, custom layers, and embeds you can publish on a municipal site | Subscription, by tier |
| Platform API | GIS, open-data and dashboard teams | Programmatic access to asset data for syncing into your system of record | Subscription, by tier |
| Partner portal | Nonprofits and community food programs | Administering programs such as kitchen credits for the people you serve | Program-based |
What does it cost?
The public map is free. Team features — saved maps, custom layers, embeds, and API access — are subscription-based through the mapping portal, with tiers sized for individuals, professionals, and organizations. Nonprofits and community partners can also participate in the kitchen credit system through the partner portal, which several communities pair with local food-security funding. Most municipalities start at zero and only reach a paid tier when they need private layers, embeds, or an API integration.
Frequently asked questions
- Can we embed the map on our municipal website?
- Yes. Saved maps from the portal embed directly into municipal sites, so residents see the live map without leaving your domain — no custom development required.
- Can residents and organizations suggest updates?
- Yes. Public suggestion workflows feed a moderated verification queue, so community knowledge improves the map without compromising its reliability.
- Does the platform replace our GIS?
- No. It maintains the food layer and hands it to your GIS through exports and the API. Your GIS team keeps their tools; your planners get a map they can actually update.
- Do we need a GIS analyst to run it?
- No. The portal is browser-based and built for planners, health teams and community partners. GIS staff get involved where they add most value: wiring the food layer into authoritative municipal data through exports or the API.
- What should a municipality map first?
- Start with the layer that answers a question someone is already asking. Licensed food premises and food-security programs are usually fastest, because the municipality already holds the records. Farms, markets and recovery sites fill in once the map is public and people can suggest additions.
- Who owns the data we add?
- Ask that of every vendor, including us. Look for full CSV and GeoJSON export at any time and an API you can script against — an inventory you cannot take with you is not infrastructure.
See your municipality's food system on one map
Explore the free map to see what is already visible in your community, then talk to us about a pilot for your planning team — we will help scope layers, load your first inventory, and connect the API to your GIS. Reach us through the contact page.
Sources
- A recipe for competition in the grocery sector — Competition Bureau Canada, Mar 19, 2026
- Direct sales from Canadian farms — Statistics Canada, Feb 9, 2023
- HungerCount 2025 — Food Banks Canada, Oct 27, 2025
- Food Systems Planning policy guide — American Planning Association

Written by
Anna Purna
AI-assisted research and city guides, reviewed by the Food Web team
AI-assisted author, reviewed by the Food Web team.
Anna Purna is Food Web's AI writing assistant — an avatar named after Annapurna, the Hindu goddess of food, agriculture, and nourishment. The name is about abundance, not a person on staff. She drafts research-backed guides; a human editor reviews them before they go live.
Next step
See every food asset near you on one map
Commercial kitchens, farms, markets and processors, mapped and updated weekly.
No listing fees · 12% on completed bookings · Refunds inside the notice window