

The short answer
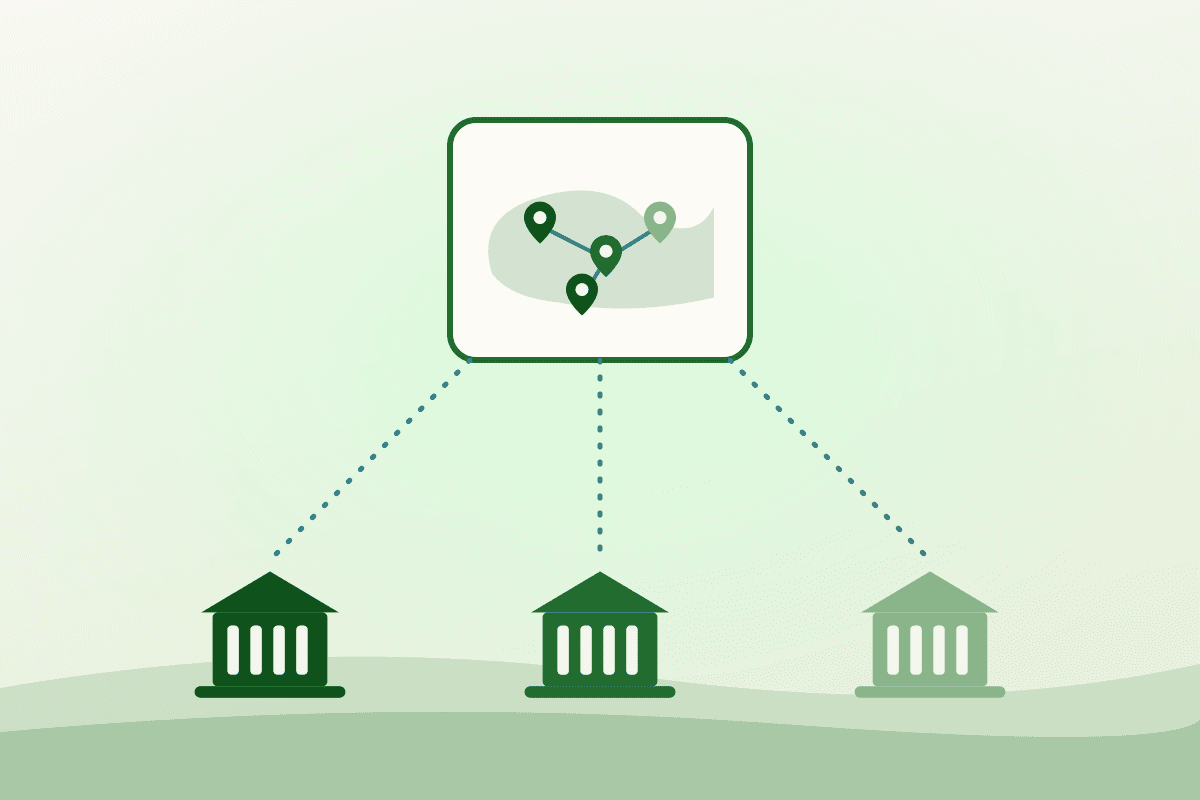
Food system mapping software is a digital platform that inventories a community's food assets — farms, commercial kitchens, processors, distributors, retailers and food-security programs — and displays them as layers on an interactive map, so every municipal department can see, share and analyse the same local food system instead of maintaining its own list.
- One inventory, many layers Local food assets presented as a shared, interactive map rather than a spreadsheet nobody owns.
- It complements GIS, it does not replace it Food-specific data models and community updates are the difference. Parcels and zoning stay in your system of record.
- Four departments, one map Planning, economic development, public health and emergency management can all work from the same food asset map.
- Six common layers Production, processing, distribution, retail, food-security programs and waste recovery.
- You can start free A free public map lets a team see what is already visible before any budget conversation.
Think of it as the connective layer between the data municipalities already hold — business licenses, health inspections, zoning parcels — and the food-system decisions they are increasingly asked to make. It is built for planners, economic developers and public health teams rather than GIS specialists, and it turns scattered records into a picture a whole municipality can share. This explainer opens our food maps series; the companion guides cover the rollout and the buying decision.
What does food system mapping software actually do?
At its core, the software answers three deceptively simple questions: what food assets exist in your municipality, where they are, and how they relate to each other. Most platforms do five jobs:
- Inventory: a structured database of food assets with location, category, capacity and contact details.
- Visualization: interactive map layers that make gaps and clusters visible at a glance — a form of local food system visualization that spreadsheets cannot offer.
- Collaboration: shared access and permissions, so departments and partners maintain one dataset instead of five copies.
- Engagement: public-facing maps and suggestion workflows that let residents and organizations contribute updates.
- Analysis: filters, exports and APIs that feed studies, grant applications and council reports.
What data belongs on a municipal food system map?
Every community's map looks different, but municipal teams usually start with six layers:
- Production: farms, community gardens, orchards and urban agriculture sites.
- Processing: commercial kitchens, co-packers, abattoirs and food hubs.
- Distribution: wholesalers, distributors, cold storage and farmers' markets.
- Retail: grocery stores, corner stores and mobile markets.
- Food security: food banks, community fridges, meal programs and school food services.
- Recovery: compost sites, gleaning programs and food waste processors.
For each asset, the useful fields are practical rather than exotic: verified location, category, operating status, capacity or scale, licensing status and a contact. The discipline is keeping them current — which is why community food planning tools treat updates as a workflow, not an annual project.
Those six layers are not small. National statistics give a sense of the scale a mid-sized municipality is sampling from:
25,917
farms in Canada reported selling directly to consumers
Statistics Canada, Census of Agriculture — 13.6% of all farms, 2020 data published 2023
Source8,800+
food and beverage processing firms with employees, about 92% of them small businesses
Competition Bureau Canada, March 2026
Source5,500+
food banks and community organizations serving people across Canada
Food Banks Canada, HungerCount 2025
SourceWhy are municipalities adopting it now?
Food policy became a cross-department job
Food used to enter municipal work through a single door — usually public health. Today it shows up in zoning applications, economic development strategies, climate and resilience plans, and emergency management. The American Planning Association’s Food Systems Planning policy guide explicitly calls on planners to treat food as core infrastructure, alongside housing and transportation. Cross-department collaboration fails quickly when each office keeps its own list of farms and food programs.
GIS teams cannot carry food data alone
Most municipal GIS departments are excellent at parcels, utilities and roads — and thinly stretched. Food asset data is volatile: businesses open, close and change hands constantly. Purpose-built GIS for food systems adds a food-specific data model and community verification on top of the base layers your GIS team already maintains. National datasets such as the USDA’s Food Environment Atlas are useful for context, but they are too coarse for street-level planning decisions.

Resilience planning needs a current picture
Supply chain shocks, floods and heat events all raise the same question: where is our local food infrastructure, and what happens if part of it goes offline? A live asset map turns that from a research project into a lookup.
How is it different from a spreadsheet or a static GIS layer?
Municipal planning tools overlap, so it helps to be precise about what each one is for. The difference shows up between planning cycles, not on launch day.
| Approach | How it holds the data | What happens between planning cycles |
|---|---|---|
| Spreadsheet | A list, usually one per department | Goes stale immediately, hides geography, and forks into conflicting copies |
| Static GIS layer | A mapped layer inside one department | Updates on project timelines rather than continuously, and needs an analyst each time |
| Food system mapping software | Map, shared database and update workflow in one place | Stays alive — community suggestions and a verification queue keep it current |
Where does Food Web fit?
Food Web runs a free public map of food assets, and an Asset Mapping Platform for teams that need saved maps, embeds and collaboration at maps.foodweb.network. Municipalities that want the data inside their own stack can use the Platform API. If you are comparing options, our guide to using food system mapping software in municipal planning walks through a step-by-step rollout, our platform overview covers features in depth, and our buyer’s guide sets out the four criteria to score vendors against.
Frequently asked questions
- Is food system mapping software the same as GIS?
- No. GIS is the general-purpose engine for spatial data; food system mapping software is a specialized application on top of it. It ships with food-specific categories, community update workflows and public sharing — and good platforms export to or integrate with your GIS rather than competing with it.
- Who uses it inside a municipality?
- Planning and zoning, economic development, public health, sustainability offices and emergency management are the usual owners. The value compounds when they share one map: a food asset mapping project pays off the second time a department reuses the data.
- How much does food system mapping software cost?
- Entry points range from free — Food Web's public map costs nothing to use — to subscription pricing for team portals with saved maps, embeds and API access. Many municipalities fund mapping through food policy, resilience or economic development grants rather than core budgets.
- How do we keep the map up to date?
- Choose a platform where updates are a daily byproduct, not an annual chore: community suggestion workflows, verification queues, and integrations with sources that change naturally — business registries, marketplace activity and place data. A map nobody can update is a report, not a tool.
- What should we map first?
- Start with the layer that answers a question someone is already asking. Licensed food premises and food-security programs are usually the fastest, because the municipality already holds the records; farms, markets and recovery sites are easier to fill in once the map is public and people can suggest additions.
Put your local food system on the map
Start by exploring the free Food Web map to see what is already visible in your community, then talk to us about a municipal pilot — we will help you scope the first layers and connect them to your existing tools. Reach the team through our contact page.
Sources
- Direct sales from Canadian farms — Statistics Canada, Feb 9, 2023
- A recipe for competition in the grocery sector — Competition Bureau Canada, Mar 19, 2026
- Canada's 2025 HungerCount — Food Banks Canada, Oct 27, 2025
- Food Systems Planning policy guide — American Planning Association
- Food Environment Atlas — USDA Economic Research Service

Written by
Anna Purna
AI-assisted research and city guides, reviewed by the Food Web team
AI-assisted author, reviewed by the Food Web team.
Anna Purna is Food Web's AI writing assistant — an avatar named after Annapurna, the Hindu goddess of food, agriculture, and nourishment. The name is about abundance, not a person on staff. She drafts research-backed guides; a human editor reviews them before they go live.
Next step
See every food asset near you on one map
Commercial kitchens, farms, markets and processors, mapped and updated weekly.
No listing fees · 12% on completed bookings · Refunds inside the notice window